Recently, I was asked if the values for maps could be shown on the map and of course the first thing I thought was to just turn on data labels. Well, if you’re reading this then you already know there isn’t currently a way to add data labels. Now, I say currently because the Power BI team is always making changes and it could one day be there.
First, this was not my idea. When I realized there was not a data label option I knew someone in the community would have figured out a work around, and I was right!
Thanks to the awesome people who contribute at community.powerbi.com the answer was only a “google kungfu” search away. If you would like to see the original forum post where Sean “Super Contributor” helped out another Power BI user then check out the following URL:
https://community.powerbi.com/t5/Desktop/Data-Labels-on-Maps/td-p/79118
This blog is going to take a look at the following three items:
- Why this workaround works
- How to set this up and configure it
- Concerns and issues with this method
Why this workaround works
The map visual in Power BI will allow you to display the value of whatever is allocated to the Location field of the map. Generally you would simply put the country, state, city, or some other valid location in this field. The limitation is that this field can only be populated with a calculated column. Therefore, Sean suggested combining the value you wanted to display into a calculated column field. Well, that allows you to now display the results, but it doesn’t map the data. The next step is you will need to have the latitude and longitude for each geographical location that needs to be mapped. The latitude and longitude coordinates will be added to the map visual to determine location and the location field will be used to display the data label.
Setup and configuration of Data Labels on Maps in Power BI!
Now, let’s dig in and build this out.
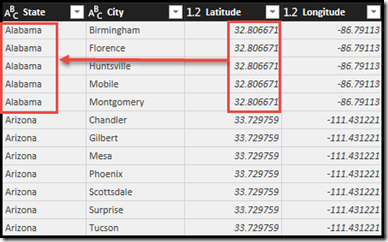
First, make sure your geography table has the required latitude and longitude columns. My geography table goes down to the zip code level of detail but I only brought in the Latitude and Longitude at the State level since I knew this is how I wanted to view the data in my map visual.
Next, it’s time to build the calculated column that will help you display the data.
- Create a new calculated column on the Geography table.
- The following DAX expression returns Total Sales by State combined with the state name.
- I also added the FORMAT function to add some formatting to the values.
- The part highlighted in the red box returns the Total Sales by State.
Now that the you have your latitude and longitudes and the calculated column has been built, it’s time to add this to a map! In the below screenshot I highlight where each of your fields should be assigned.
Finally, it’s time to display our Location on the map!
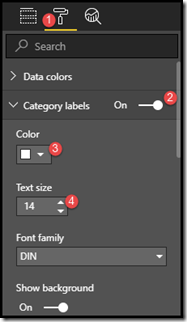
- Under formatting options turn on Category Labels
- Feel free to change the properties for color, text size, show background and transparency.
Concerns and Issues
First of all, you must store your values in a calculated column in order to display them.
- This means that your values will be static, they won’t change as slicers change.
- You need to know exactly what and how your end users will use the data, which is nearly impossible.
- This column will take up resources in your data model.
Secondly, you must have the latitude and longitude for every location you want to put on your map.
- It may be difficult to obtain a quality list of latitudes and longitudes for each address.
- These additional columns in your data model will have a high level of uniqueness and will definitely consume valuable memory resources.
Enjoy!


Pingback: Create an Interactive Legend in your Power BI Map – data witches