HASONEVALUE vs ISFILTERED in DAX

I use the function HASONEVALUE quite often, many times it is in the context of solving problems with the total row. I wrote a blog on how to handle totals using HASONEVALUE here:

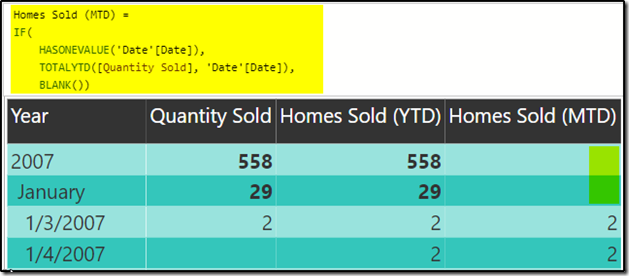
Unfortunately, HASONEVALUE is not always the tool for the job. For this scenario I am returning Homes Sold Month-to-Date. The final solution should look like the following screenshot:

image

As you can see in the previous image we want to return the Homes Sold MTD if we are at the day level or the month level, but if we are at a level higher than the month level then we simply want to return a blank value. It doesn’t make sense in this scenario to show MTD homes sold at the quarter or year level. If we use HASONEVALUE(‘date’[Date]) here, then no value is returned at the Month level. Here is an example:

image

As you can see in this example, a blank value is returned for the month of January. As previously mentioned the desired behavior is to return a value for the month of January.

IsFiltered

IsFiltered: Returns TRUE when columnName is being filtered directly. Else, False.

Let’s take a look at what IsFiltered returns if we are checking to see if the date is filtered:

image

ISFILTERED returns False for the month and Year as expected. Now, we can simply chain multiple IsFiltered functions together to return our desired results. In the following screenshot I added an or condition to check if the month was also filtered. As you can see, the results now return TRUE at the day and month level.

image

Now we can apply some conditional logic using the IF function based on the results of the IsFiltered expression in example above. If the day or month IsFiltered then return the MTD homes sold, else return BLANK(). See below:

image

Thanks for checking out my blog!

PowerApp customizations

In my last blog post, you learned how easy it is to quickly create your first app. In this follow-up blog I want to show you how you can make some basic customizations to the app that was created in the previous post.

You can find my previous blog here:

What’s covered

In this post we are going to quickly cover the following customizations:

  • Renaming
  • Currency Formatting
  • Default properties

1_

In this first image we can see that the name of the title on the screen has an underscore instead of a space. Secondly, we see that the default value of the expense amount is not consistent. We are going to quickly update each of these items.

Renaming controls:

  • First, select the title. This can be done by either clicking the title directly or by finding the text input control from the left navigation bar.
  • Secondly, select text from the drop down list of properties on the control selected, this may be the default property.
  • Finally, update the text value in the formula bar. Replace the underscore with a space.

image

Customizing currency formatting

Now we are going to update the currency formatting. To update formatting we are going to use the Text function and we will once again be working in the formula bar.

  • Select the control currently displaying the expense amount. Once again, you can select this control directly from the app or select the control from the Left Navigation bar.
  • Make sure Text is selected from the drop down properties box, this should be the default selection.
  • Update the formula bar to format the output text, see code below image.

2_

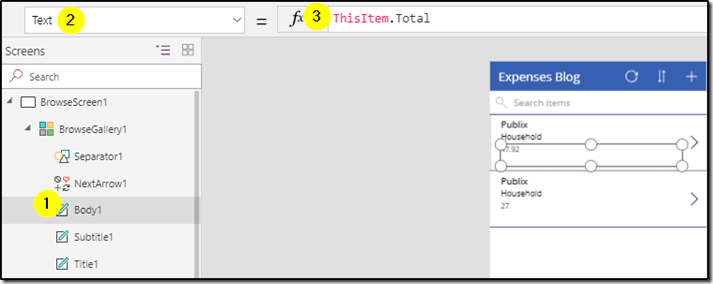
The formula is Text(ThisItem.Total, “$#,###.00”), see image below:

3_TextFunction

Setting Default Values

The final customization we will make is to set default values, this will make working and interacting with the app a much better experience. For example, the date will always default to the current date when adding new expenses.

I’m going navigate to appropriate screen by selecting the EditScreen1 from the Left Navigation bar, this will take me to the edit screen where we can edit existing records or create new records. This behavior of being able to edit or create new records is done through the Edit Form control. The form control is slightly unique because the controls inside the edit form are stored in cards and those cards are Locked! Let’s unlock the card so we can customize it:

  • First, select the card control from the Left Navigation bar.

4_

    • Next, navigate to the properties window found on the right side of the screen and select Advanced, in the advanced properties click Unlock to change properties. This will now unlock the card so that we can edit the controls.

5_

  • Next, select the date picker control.

6_

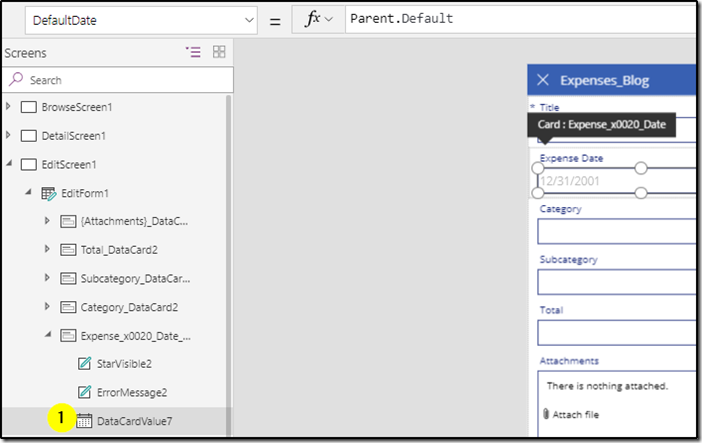
  • Finally, update the formula for DefaultDate to simply Now(). As you can see in the screenshot below, the date of the date picker control will now default to the current date whenever a new record is being added in the app!

7_

As always, thanks for reading my blog.

Creating your first PowerApp in 10 minutes!

Microsoft PowerApps is a canvas based application for creating line of business applications. In other words, you can create an app for your organization by using a drag an drop interface! Personally, I love the capabilities and ease of use of PowerApps. What makes PowerApps even cooler is the fact that you can build apps really really quickly!

In this first blog post of many on working with PowerApps I want to focus on creating an app that has little to no customizations. This post will focus on a step by step approach to creating your first app. We are going to use an option in PowerApps that will build an app for us, using our data. Yes! Build the app for us! We could customize this and make it our own and there is a lot we can do but I want to get you started so we want to keep this first post simple.

To build our app we need a data source. For this example I am going to use a SharePoint list to keep it simple. If you want to use data stored on-prem this requires slightly more work, not much, but slightly more and so I will come back to this in a future blog post.

Let’s discuss the steps we will take to build our first app:

  1. Create the data source and populate it with sample data.
  2. Log into web.powerapps.com and create a connection to our data.
  3. Create a new app using the option: Create from data.
  4. SAVE APP!

It’s really that simple! Now let’s take a look at the data source.

Using SharePoint as a data source for PowerApps

In the below image you can see I have created a SharePoint list called Expense_Blog and I have added five columns. I then populated the list with a single row of data so I would have some sample data to preview my app with. I prefer to always start with sample data as I have found this makes building and customizing the app easier.

image

Creating a Data Connection in PowerApps

Open up your browser and connect to www.powerapps.com. From the left navigation pane, expand data and the click connections.

image

This will open up a window with all the connections you have already created. To create a connection to SharePoint, click + New Connection.

image

Select SharePoint from the list of available connections:

image

Once you select SharePoint you will be prompted to enter your credentials, and this will create the connection to SharePoint. Next, navigate to the home tab, then hover over Start from data and click Make this app.

image

Clicking Make this app will launch create.powerapps.com. Once launched you will be asked to connect to your data. Select SharePoint.

image

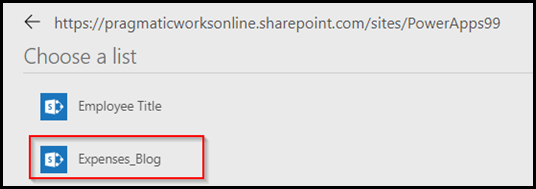
Now you need to connect to the specific SharePoint site where your list has been stored. My list has been stored in my PowerApps99 site.

image

Select your list from the options available and then click CONNECT. After you click connect your app will be created. You will get a pop up screen, you can just click SKIP for now.

image

The created app comes with three screens.  A display screen, a details screen, and an edit screen. As you can see below the display screen will show all of our current expenses, unfortunately it’s not showing the columns we want to see. I’m going to show you how to use the GUI to customize the display screen to show the correct columns.

image

To customize the display gallery, take a look at the below animated gif. Essentially I select the gallery, then go into the properties and update the columns.

ExpenseApp

Now let’s test our our new app by previewing it. Click on the play icon at the top right to preview the app. Take a look at the animated gif below:

ExpenseApp_Play

The last step is to save the app. Click File –> Save as –> The Cloud –> Blog Expense App –> Save!

image

Thanks for reading.

DAX LASTDATE vs. LASTNONBLANK

In my previous blog post I discussed how the time intelligence function CLOSINGBALANCEMONTH worked great, except when it didn’t. If you remember, the problem was the function CLOSINGBALANCEMONTH could not handle situations where the data had gaps, or blanks on specific dates.

If you missed the previous blog post, you can find it here:

In this post,  I want to build a measure that returns the closing price for the date in the current context. My initial attempt at this measure is going to suffer from the same issue we faced when working with the CLOSINGBALANCEMONTH function in the last blog. Let’s start by using CALCULATE and LASTDATE.

Working with LASTDATE

Here is your MSDN definition of LASTDATE: “returns the last date in the current context for the specified column of dates”.

This function is great because it works in the current context so it makes the measures you author in DAX very dynamic. For example:

  • If the current context is month, LASTDATE returns the last day of the month.
  • If the current context is Quarter, LASTDATE returns the last day of the quarter.
  • If the current context is day, the day in the current context is returned.

This means that the LASTDATE function automatically works for each level in your date hierarchy, this is why we like working with DAX, because of this type of functionality.

Let’s take a look at a simple example of LASTDATE:

image

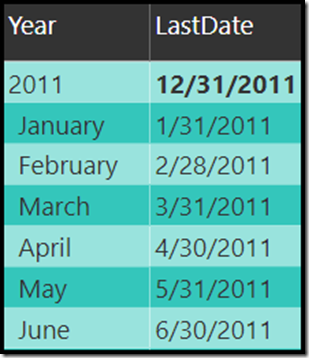
This simple calculated measures returns the following:

image

As you can see in this screenshot, LASTDATE is returning the last date of the current context, in this visual we have the month and the year.

Next, I will create a new measure that returns the Closing Price of the current time period. The following measure returns the Closing Price of the stock for the last day of the month:

image

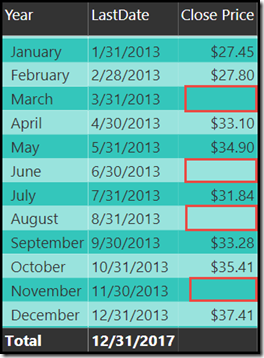
If we take a look at the results in our table visual, we will see that our measure is returning blanks for certain months. The reason this is occurring is because the stock market isn’t open every day of the year, therefore, if there is no closing price for the last day of the month then a blank value is returned.

image

LASTNONBLANK function in DAX

I discussed the LASTNONBLANK function in my previous blog post, so I won’t get too detailed here but here is the definition and syntax from MSDN:

Definition: Returns the last value in the column, filtered by the current context, where the expression is not blank.

Syntax: LASTNONBLANK(<column>, <expression>)

LASTNONBLANK will return the last date in the current context that wasn’t blank, that is the perfect function for this scenario.

image

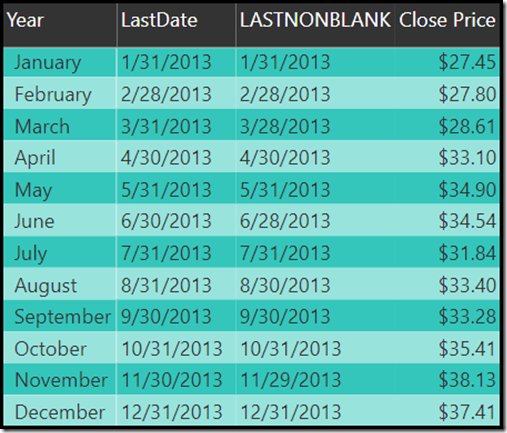
Let’s take a look at the results of LASTNONBLANK compared to LASTDATE. In the highlighted sections below, notice that for each area where the close price is blank the results of the LASTDATE function and LASTNONBLANK function differ. As previously discussed, the stock market was closed on the last date of the month and therefore the close price does not return a value.

image

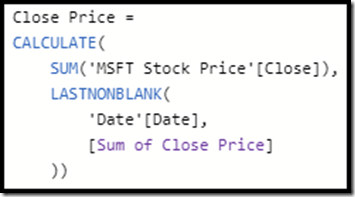
Now it’s time to modify the Close Price measure so that it returns the last close price for the current context:

image

Here are the final results:

image

Thanks for reading, enjoy!